Tuesday, August 27, 2013
Sunday, August 25, 2013
Robustness of a network
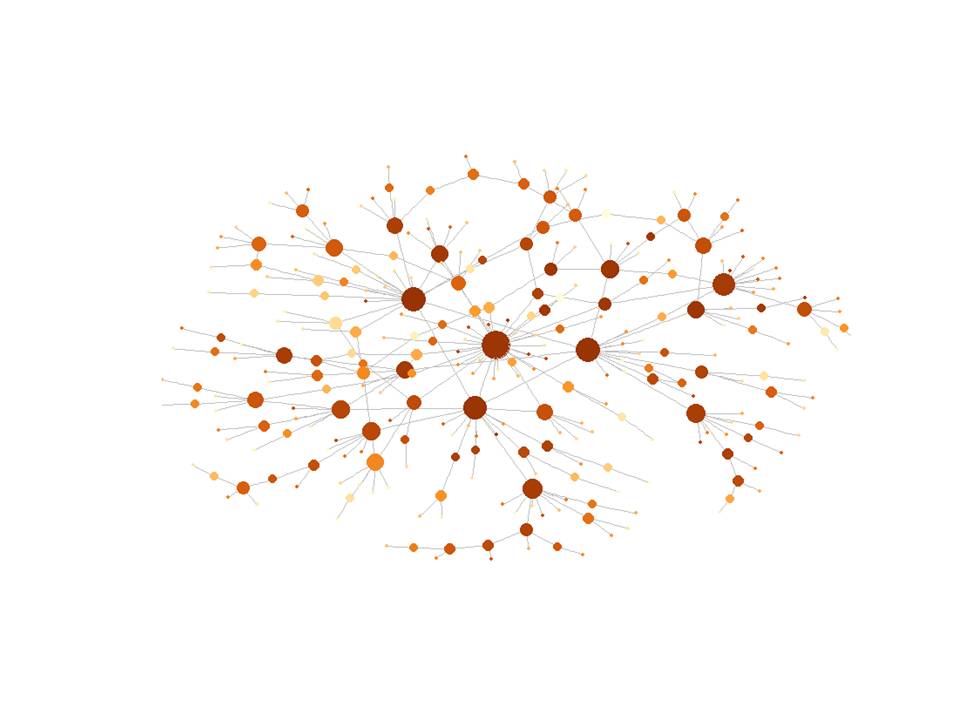
The following graph is the final network model state as discussed in my
previous blog (http://businessfractal.blogspot.com/2013/08/to-rent-or-buy-dashboard-analytical.html),
where I indicated the ability to determine the robustness of a network from a
network simulation (http://youtu.be/oBb5RjorMP8).

The key statistics of the network can be found as being:
Number of Vertices: 303
Number of Edges: 326
Diameter of network: 13
Mean Degree of the network: 2.151815
Maximum Degree of the network: 32
Mean Geodesic of the network: 5.136059
Density of the network : 0.0071017
Transitivity of the network:0.003640777
Robustness of the network can be tested in two ways, first by attacking the highest connected hubs in a structured manner, and then by removing nodes in a random manner. The simplest measure to test this impact is the average distance (mean geodesic) of the network. The following graphs shows a few simulations by removing 55% of nodes in the network. The blue line shows the failure in the average path if a structured attack is carried out, with the red lines resulting from random attacks. From a structured perspective this network is highly fragile, failing in less than 1% of node removals, where-as the network is quite robust when being attack in a random manner. Whether this is good or bad naturally depends on the application; if we want to design a marketing campaign, then we might rather use a structured approach to implement it, as apposed to a random approach. If it is a supply chain network, the structured attack will be of high concern from a risk management perspective.

Finally, analysis of the network model indicates that this model is a scale-free network, as the connection degree do follow a power-law behaviour, which does indicates the reason for the network fragility under structured and random attacks.

Thursday, August 22, 2013
TO RENT OR BUY DASHBOARD ANALYTICAL TOOLS FOR +10000-20000 EURO PER ANNUM ?
I just evaluated a fancy dashboard/analytical toolset in my search for solving a specific problem; very nice to drag and drop stuff and get some fancy pictures out.
I then received the quote for the perpetual/annual licence agreement/pay-me-as-much-as-possible-for-fancy-graphs.
Got a bit green when I saw the price and then to calm myself I went and grab a few lines of brilliant opensource R code from a blog to do a dynamic network model (I am busy trying to calculate the diffusion rates in market segments from complex network structures).
Here is the result: http://youtu.be/oBb5RjorMP8
The next step will be to insert 3 lines of R code to calculate and model a random attack on the network to see the level of network robustness. And add another 3 lines to model a structured attack on the key nodes and understand the overall fragility of the design. Then plot it all with R ggplot which is free.
Advice asked & advice given is free.
Can check all code and see all results, can also mingle a bit of Monte Carlo simulation into it as well; it still stays free. It feels like a good deal to me, especially having the freedom to do as I like.
Don't see how a scientist or engineer can work with analytical tools which generates by "magic"
answers which cannot be verified - too restrictive and dangerous for me. Not to get it wrong, there are some very specialist good ones out there like for example the Disco toolset from www.Fluxicon.com , but then at least I can read the Phd's from the founders and understand what the
wiring is all about... that's cool.
I still think that a fool with a tool is still a fool - even if the tool is Visio or Powerpoint or Excel.
Subscribe to:
Posts (Atom)
Popular Posts
-
 In my previous blog I speculated about the practical application of complexity sciences to assist in business management. In this blog I ...
 -
 What are ‘enterprise assets’? They are all the resources and activities that make it possible to set up and run a business. They include not...
 -
I just evaluated a fancy dashboard/analytical toolset in my search for solving a specific problem; very nice to drag and drop stuff and get ...
-
It is now 8 years since I bought a 1500 GBP report on how to measure complexity in business. I also remember how I read Mandelbrot's ...
-
 WHAT DOES MOUNT EYJAFJALLAJOKULL TEACHES US ABOUT COMPLEXITY ? As I sit next to the beautiful Lake Como, I ponder on the complexity concep...
 -
 According to Google, the next transformation of business will be due to maps . The Boston Consulting Group states that 95% of businesse...
 -
 About a year ago I saw a presentation from a group of telco business analysts. One particular slide caught my eye which contained a classic...
 -
 It will be hell if I have to use Excel to solve data science problems............... Then suicide will definitely follow if I have to pre...
 -
Why is the definition of complexity important to anybody? From a generalist viewpoint, complexity is something that we all deal with on a ...
-
 Being frustrated with my bank's services i thought it good to check if i was the only person having issues. I went ahead and mined all p...