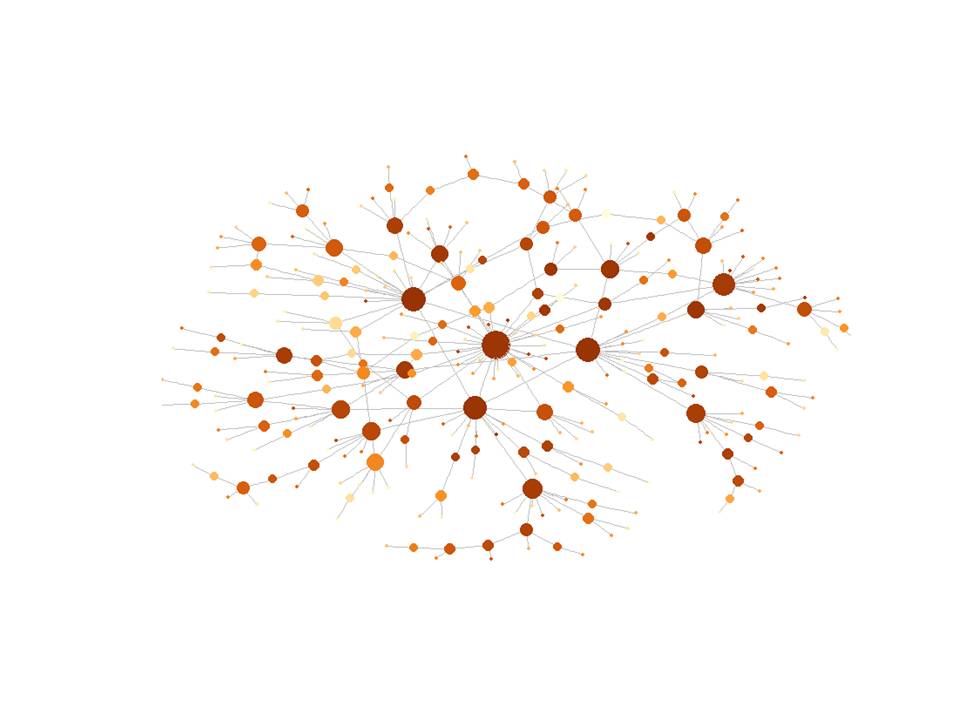
Number of Vertices: 303
Number of Edges: 326
Diameter of network: 13
Mean Degree of the network: 2.151815
Maximum Degree of the network: 32
Mean Geodesic of the network: 5.136059
Density of the network : 0.0071017
Transitivity of the network:0.003640777
Robustness of the network can be tested in two ways, first by attacking the highest connected hubs in a structured manner, and then by removing nodes in a random manner. The simplest measure to test this impact is the average distance (mean geodesic) of the network. The following graphs shows a few simulations by removing 55% of nodes in the network. The blue line shows the failure in the average path if a structured attack is carried out, with the red lines resulting from random attacks. From a structured perspective this network is highly fragile, failing in less than 1% of node removals, where-as the network is quite robust when being attack in a random manner. Whether this is good or bad naturally depends on the application; if we want to design a marketing campaign, then we might rather use a structured approach to implement it, as apposed to a random approach. If it is a supply chain network, the structured attack will be of high concern from a risk management perspective.

Finally, analysis of the network model indicates that this model is a scale-free network, as the connection degree do follow a power-law behaviour, which does indicates the reason for the network fragility under structured and random attacks.


No comments:
Post a Comment